# MapleGrid
 # Scope:
Building an honeypot "network" with a central instance that aggregates the data collected.
# Idea:
# Scope:
Building an honeypot "network" with a central instance that aggregates the data collected.
# Idea:
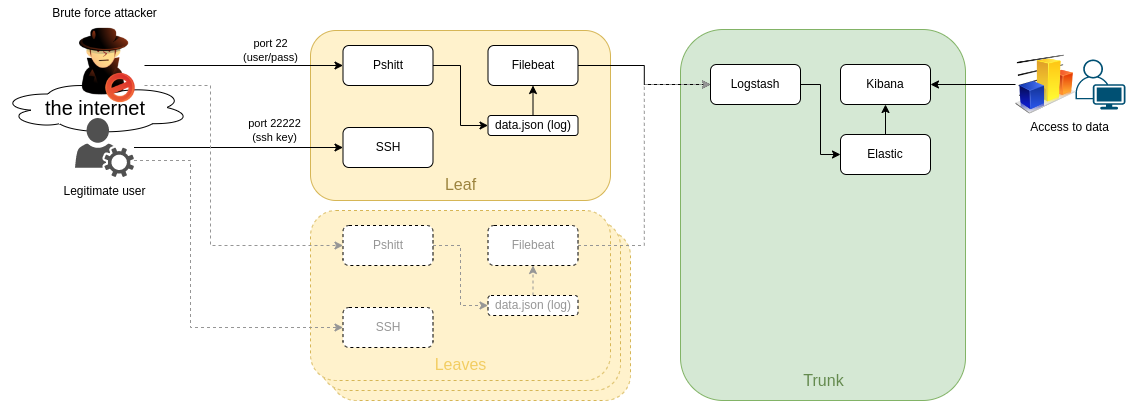 The idea is having as many "leaves" as we may so we can sense the "wind" and send everything to a central "trunk" where the info is processed.
This way we can have our little network of ssh honeypots and do something with the data.
the "leaves" will leverage [Pshitt](https://github.com/regit/pshitt) made by [regit](https://github.com/regit), a python program that simulates an ssh server with user/pass authentication.
Differently from a real ssh server Pshitt stores the data of the brute force access in json format, for example:
```json
{"username": "user", "try": 1, "src_port": 47097, "software_version": "libssh2_1.4.2", "timestamp": "2022-05-25T19:50:00.123456", "src_ip": "123.123.123.123", "mac": "hmac-sha1", "cipher": "aes128-ctr", "password": "password"}
```
- username
- try: number of try of the 3 before disconnection
- src_port
- software_version
- timestamp
- src_ip
- mac
- cipher
- password
# Components:
### pshitt
our ssh honeypot
### filebeat
a lightweight log-shipper to be used on the leaves
### logstash
where we do a little processing of the data and add geo-ip data
I tried using logstash directly on the leaves but it's too resource hungry
### elasticsearch
where we store our data
### kibana
used for exploring data and creating dashboards
# Network configuration:
On the leaves I assume we will have a public ip address, so we can expose:
- port 22: pshitt
- port 22222: the real ssh server we need to manage the machine
The trunk would not need any exposed port (at least by design) since we should be able to reoute everything via a VPN or protected connection,
in case we cannot do anything like that the port we need to expose:
- port 5044: logstash for filebeat
# How-To:
## "Trunk" node (ELK stack):
### Install:
install and configure Elasticsearch on a machine,
preferably with some cores and some GB of ram (I am using 4 cores and 6GB ram),
since I am not very keen on ELK (and I am leveraging this project to learn something), I have used these articles: [[0]] and [[1]]
NB: this is a single node "quick and dirty" installation of Elasticsearch and Kibana for a POC.
```bash
#install ELK v7.x:
wget -qO - https://artifacts.elastic.co/GPG-KEY-elasticsearch | apt-key add -
apt-get install apt-transport-https
echo "deb https://artifacts.elastic.co/packages/7.x/apt stable main" | tee -a /etc/apt/sources.list.d/elastic-7.x.list
apt update
apt install elasticsearch kibana logstash filebeat
#filebeat is onyl needed if you wish to host the honeypot on the trunk node
cat < /etc/elasticsearch/elasticsearch.yml
cluster.name: maplegrid
node.name: maplenode-01
path.data: /var/lib/elasticsearch
path.logs: /var/log/elasticsearch
network.host: 0.0.0.0
discovery.type: single-node
node.ingest: true
EOF
cat < /etc/kibana/kibana.yml
server.port: 5601
server.host: "0.0.0.0"
server.name: "maplegrid-kibana"
elasticsearch.hosts: ["http://localhost:9200"]
EOF
systemctl enable elasticsearch
systemctl enable logstash
systemctl enable kibana
systemctl start elasticsearch
systemctl start logstash
systemctl start kibana
```
### Check if Elasticsearch is ok:
at this point you should be able to ask Elastic how it feels:
```bash
curl -XGET http://localhost:9200/_cluster/health?pretty
```
expecting an answer like this:
```json
{
"cluster_name" : "maplegrid",
"status" : "yellow",
"timed_out" : false,
"number_of_nodes" : 1,
"number_of_data_nodes" : 1,
"active_primary_shards" : 15,
"active_shards" : 15,
"relocating_shards" : 0,
"initializing_shards" : 0,
"unassigned_shards" : 3,
"delayed_unassigned_shards" : 0,
"number_of_pending_tasks" : 0,
"number_of_in_flight_fetch" : 0,
"task_max_waiting_in_queue_millis" : 0,
"active_shards_percent_as_number" : 83.33333333333334
}
```
and you should be able to connect to Kibana on the ip address of the server on port 5601.
### Logstash config:
now we can configure Logstash:
edit /etc/logstash/conf.d/pshitt.conf
```
input {
beats {
port => 5044
}
}
filter {
# warn logstash that timestamp is the one to use
if [type] == "json-log" {
date {
match => [ "timestamp", "ISO8601" ]
}
}
geoip {
default_database_type => "City"
source => "src_ip"
tag_on_failure => ["geoip-city-failed"]
}
geoip {
default_database_type => "ASN"
source => "src_ip"
tag_on_failure => ["geoip-asn-failed"]
}
}
output {
elasticsearch {
hosts => "http://localhost:9200"
index => "pshitt"
}
}
```
As you can see our input is not a file but we'll listen on port 5044 for our remote filebeat clients.
The "geo-ip" part is needed to add the geo-data info starting from the attacker IP,
the split configuration is needed because the filter can process "City" or "ASN" data but not both at the same time,
so we need to split the configuration. Thanks to leandrojmp [[2]].
The output is out Elasticsearch node.
the restart Logstash:
```bash
systemctl retart logstash
```
in case you need to debug logstash (I had to), you can read: /var/log/logstash/logstash-plain.log
## "Leaf" node (honeypot + logshipper):
I've create an Ansible playbook to configure everything but we'll obviously see the steps,
it's been test on both Debian 9 and 10.
### Ansible Playbook:
Playbook: [maplegrid.yml](/img/20220525_01_maplegrid_honeypot_files/maplegrid.yml)
Variables file: [maplegrid_variables.yml](/img/20220525_01_maplegrid_honeypot_files/maplegrid_variables.yml)
### Add elastic repo and install filebeat:
```bash
curl -fsSL https://artifacts.elastic.co/GPG-KEY-elasticsearch | apt-key add -
apt-get install apt-transport-https
echo "deb https://artifacts.elastic.co/packages/7.x/apt stable main" | tee -a /etc/apt/sources.list.d/elastic-7.x.list
apt update
apt install filebeat
```
### change ports:
in /etc/ssh/sshd_config we'll change the port to 22222
Port 22222
(if you are using it, but you really should) in fail2ban we are gonna change the port of the ssh jail to 22222,
look for the config:
```bash
[sshd]
port = ssh
```
and change it to:
```bash
[sshd]
port = 22222
```
!!!!!!!FIX YOU FIREWALL TO ALLOW CONNECTION ON PORT 22222!!!!!!!! (Ansible will do this for you if you are using iptables, otherwise it's your task)
then restart fail2ban and ssh:
```bash
systemctl restart fail2ban
systemctl restart ssh
```
in this moment your connection will remain active,
it's the moment if you can ssh into the machine on port 22222:
```bash
ssh user@machine -p 22222
```
### Pshitt:
install the dependencies of pshitt:
```bash
apt install python-pip
pip install python-daemon argparse paramiko
```
clone the repo of Pshitt in /srv/pshitt:
```bash
git clone https://github.com/regit/pshitt /srv/pshitt
```
create the systemd unitfile we are going to use to start the service,
create the log directory and enable+start pshitt:
```bash
cat < /etc/systemd/system/pshitt.service
[Unit]
Description=pshitt service
Wants=network-online.target
After=network-online.target
[Service]
ExecStart=/srv/pshitt/pshitt.py -p 22 -k /etc/ssh/ssh_host_rsa_key -o /var/log/pshitt/data.json -l /var/log/pshitt/log.log
[Install]
WantedBy=multi-user.target
EOF
mkdir /var/log/pshitt
systemctl enable pshitt
systemctl start pshitt
```
notice the "-k /etc/ssh/ssh_host_rsa_key",
we are using the keys of our real machine and not the ones shipped with pshitt to avoid being discovered.
at this point if you try to log into your honeypot:
```bash
ssh -o PreferredAuthentications=password -o PubkeyAuthentication=no user@YOUR_PUB_IP -p 22
```
you should se an entry in /var/log/pshitt/data.json
### Filebeat:
now we can configure filebeat to send the data to logstash (change the strings starting with "YOUR_":
```bash
cat < /etc/filebeat/filebeat.yml
filebeat.inputs:
- type: log
enabled: true
paths:
- /var/log/pshitt/data.json
json.keys_under_root: true
processors:
- drop_fields:
fields: ["beat", "source", "prospector", "offset", "host", "log", "input", "event", "fileset" ]
- add_fields:
target: ''
fields:
pshitt_host: YOUR_LEAF_NODE_NAME
output.logstash:
hosts: ["YOUR_LOGSTASH_IP:YOUR_LOGASTASH_BEAT-PORT"]
#Filebeat service logging:
logging.level: info
logging.to_files: true
logging.files:
path: /var/log/filebeat
name: filebeat
keepfiles: 7
permissions: 0640
EOF
systemctl enable filebeat
systemctl start filebeat
```
at this point if we try another login on the honeypot we should see the data in Kibana.
### Kibana:
log into Kibana and create a new index pattern:
Management --> Kibana --> Index Patterns --> New
- Name: pshitt*
- Timestamp field: @timestamp
now go to:
Analytics --> Discover
select your index pattern and you should see some data
we can also create dashboards ( Analytics --> Dashboard ),
I've tried to export what I did (it still lacks geo-ip data since I have some issues), but I don't know if the import works:
Kibana Dashboard: [kibana_dashboard.njson](/img/20220525_01_maplegrid_honeypot_files/kibana_dashboard.njson)
My dashboard:
The idea is having as many "leaves" as we may so we can sense the "wind" and send everything to a central "trunk" where the info is processed.
This way we can have our little network of ssh honeypots and do something with the data.
the "leaves" will leverage [Pshitt](https://github.com/regit/pshitt) made by [regit](https://github.com/regit), a python program that simulates an ssh server with user/pass authentication.
Differently from a real ssh server Pshitt stores the data of the brute force access in json format, for example:
```json
{"username": "user", "try": 1, "src_port": 47097, "software_version": "libssh2_1.4.2", "timestamp": "2022-05-25T19:50:00.123456", "src_ip": "123.123.123.123", "mac": "hmac-sha1", "cipher": "aes128-ctr", "password": "password"}
```
- username
- try: number of try of the 3 before disconnection
- src_port
- software_version
- timestamp
- src_ip
- mac
- cipher
- password
# Components:
### pshitt
our ssh honeypot
### filebeat
a lightweight log-shipper to be used on the leaves
### logstash
where we do a little processing of the data and add geo-ip data
I tried using logstash directly on the leaves but it's too resource hungry
### elasticsearch
where we store our data
### kibana
used for exploring data and creating dashboards
# Network configuration:
On the leaves I assume we will have a public ip address, so we can expose:
- port 22: pshitt
- port 22222: the real ssh server we need to manage the machine
The trunk would not need any exposed port (at least by design) since we should be able to reoute everything via a VPN or protected connection,
in case we cannot do anything like that the port we need to expose:
- port 5044: logstash for filebeat
# How-To:
## "Trunk" node (ELK stack):
### Install:
install and configure Elasticsearch on a machine,
preferably with some cores and some GB of ram (I am using 4 cores and 6GB ram),
since I am not very keen on ELK (and I am leveraging this project to learn something), I have used these articles: [[0]] and [[1]]
NB: this is a single node "quick and dirty" installation of Elasticsearch and Kibana for a POC.
```bash
#install ELK v7.x:
wget -qO - https://artifacts.elastic.co/GPG-KEY-elasticsearch | apt-key add -
apt-get install apt-transport-https
echo "deb https://artifacts.elastic.co/packages/7.x/apt stable main" | tee -a /etc/apt/sources.list.d/elastic-7.x.list
apt update
apt install elasticsearch kibana logstash filebeat
#filebeat is onyl needed if you wish to host the honeypot on the trunk node
cat < /etc/elasticsearch/elasticsearch.yml
cluster.name: maplegrid
node.name: maplenode-01
path.data: /var/lib/elasticsearch
path.logs: /var/log/elasticsearch
network.host: 0.0.0.0
discovery.type: single-node
node.ingest: true
EOF
cat < /etc/kibana/kibana.yml
server.port: 5601
server.host: "0.0.0.0"
server.name: "maplegrid-kibana"
elasticsearch.hosts: ["http://localhost:9200"]
EOF
systemctl enable elasticsearch
systemctl enable logstash
systemctl enable kibana
systemctl start elasticsearch
systemctl start logstash
systemctl start kibana
```
### Check if Elasticsearch is ok:
at this point you should be able to ask Elastic how it feels:
```bash
curl -XGET http://localhost:9200/_cluster/health?pretty
```
expecting an answer like this:
```json
{
"cluster_name" : "maplegrid",
"status" : "yellow",
"timed_out" : false,
"number_of_nodes" : 1,
"number_of_data_nodes" : 1,
"active_primary_shards" : 15,
"active_shards" : 15,
"relocating_shards" : 0,
"initializing_shards" : 0,
"unassigned_shards" : 3,
"delayed_unassigned_shards" : 0,
"number_of_pending_tasks" : 0,
"number_of_in_flight_fetch" : 0,
"task_max_waiting_in_queue_millis" : 0,
"active_shards_percent_as_number" : 83.33333333333334
}
```
and you should be able to connect to Kibana on the ip address of the server on port 5601.
### Logstash config:
now we can configure Logstash:
edit /etc/logstash/conf.d/pshitt.conf
```
input {
beats {
port => 5044
}
}
filter {
# warn logstash that timestamp is the one to use
if [type] == "json-log" {
date {
match => [ "timestamp", "ISO8601" ]
}
}
geoip {
default_database_type => "City"
source => "src_ip"
tag_on_failure => ["geoip-city-failed"]
}
geoip {
default_database_type => "ASN"
source => "src_ip"
tag_on_failure => ["geoip-asn-failed"]
}
}
output {
elasticsearch {
hosts => "http://localhost:9200"
index => "pshitt"
}
}
```
As you can see our input is not a file but we'll listen on port 5044 for our remote filebeat clients.
The "geo-ip" part is needed to add the geo-data info starting from the attacker IP,
the split configuration is needed because the filter can process "City" or "ASN" data but not both at the same time,
so we need to split the configuration. Thanks to leandrojmp [[2]].
The output is out Elasticsearch node.
the restart Logstash:
```bash
systemctl retart logstash
```
in case you need to debug logstash (I had to), you can read: /var/log/logstash/logstash-plain.log
## "Leaf" node (honeypot + logshipper):
I've create an Ansible playbook to configure everything but we'll obviously see the steps,
it's been test on both Debian 9 and 10.
### Ansible Playbook:
Playbook: [maplegrid.yml](/img/20220525_01_maplegrid_honeypot_files/maplegrid.yml)
Variables file: [maplegrid_variables.yml](/img/20220525_01_maplegrid_honeypot_files/maplegrid_variables.yml)
### Add elastic repo and install filebeat:
```bash
curl -fsSL https://artifacts.elastic.co/GPG-KEY-elasticsearch | apt-key add -
apt-get install apt-transport-https
echo "deb https://artifacts.elastic.co/packages/7.x/apt stable main" | tee -a /etc/apt/sources.list.d/elastic-7.x.list
apt update
apt install filebeat
```
### change ports:
in /etc/ssh/sshd_config we'll change the port to 22222
Port 22222
(if you are using it, but you really should) in fail2ban we are gonna change the port of the ssh jail to 22222,
look for the config:
```bash
[sshd]
port = ssh
```
and change it to:
```bash
[sshd]
port = 22222
```
!!!!!!!FIX YOU FIREWALL TO ALLOW CONNECTION ON PORT 22222!!!!!!!! (Ansible will do this for you if you are using iptables, otherwise it's your task)
then restart fail2ban and ssh:
```bash
systemctl restart fail2ban
systemctl restart ssh
```
in this moment your connection will remain active,
it's the moment if you can ssh into the machine on port 22222:
```bash
ssh user@machine -p 22222
```
### Pshitt:
install the dependencies of pshitt:
```bash
apt install python-pip
pip install python-daemon argparse paramiko
```
clone the repo of Pshitt in /srv/pshitt:
```bash
git clone https://github.com/regit/pshitt /srv/pshitt
```
create the systemd unitfile we are going to use to start the service,
create the log directory and enable+start pshitt:
```bash
cat < /etc/systemd/system/pshitt.service
[Unit]
Description=pshitt service
Wants=network-online.target
After=network-online.target
[Service]
ExecStart=/srv/pshitt/pshitt.py -p 22 -k /etc/ssh/ssh_host_rsa_key -o /var/log/pshitt/data.json -l /var/log/pshitt/log.log
[Install]
WantedBy=multi-user.target
EOF
mkdir /var/log/pshitt
systemctl enable pshitt
systemctl start pshitt
```
notice the "-k /etc/ssh/ssh_host_rsa_key",
we are using the keys of our real machine and not the ones shipped with pshitt to avoid being discovered.
at this point if you try to log into your honeypot:
```bash
ssh -o PreferredAuthentications=password -o PubkeyAuthentication=no user@YOUR_PUB_IP -p 22
```
you should se an entry in /var/log/pshitt/data.json
### Filebeat:
now we can configure filebeat to send the data to logstash (change the strings starting with "YOUR_":
```bash
cat < /etc/filebeat/filebeat.yml
filebeat.inputs:
- type: log
enabled: true
paths:
- /var/log/pshitt/data.json
json.keys_under_root: true
processors:
- drop_fields:
fields: ["beat", "source", "prospector", "offset", "host", "log", "input", "event", "fileset" ]
- add_fields:
target: ''
fields:
pshitt_host: YOUR_LEAF_NODE_NAME
output.logstash:
hosts: ["YOUR_LOGSTASH_IP:YOUR_LOGASTASH_BEAT-PORT"]
#Filebeat service logging:
logging.level: info
logging.to_files: true
logging.files:
path: /var/log/filebeat
name: filebeat
keepfiles: 7
permissions: 0640
EOF
systemctl enable filebeat
systemctl start filebeat
```
at this point if we try another login on the honeypot we should see the data in Kibana.
### Kibana:
log into Kibana and create a new index pattern:
Management --> Kibana --> Index Patterns --> New
- Name: pshitt*
- Timestamp field: @timestamp
now go to:
Analytics --> Discover
select your index pattern and you should see some data
we can also create dashboards ( Analytics --> Dashboard ),
I've tried to export what I did (it still lacks geo-ip data since I have some issues), but I don't know if the import works:
Kibana Dashboard: [kibana_dashboard.njson](/img/20220525_01_maplegrid_honeypot_files/kibana_dashboard.njson)
My dashboard:
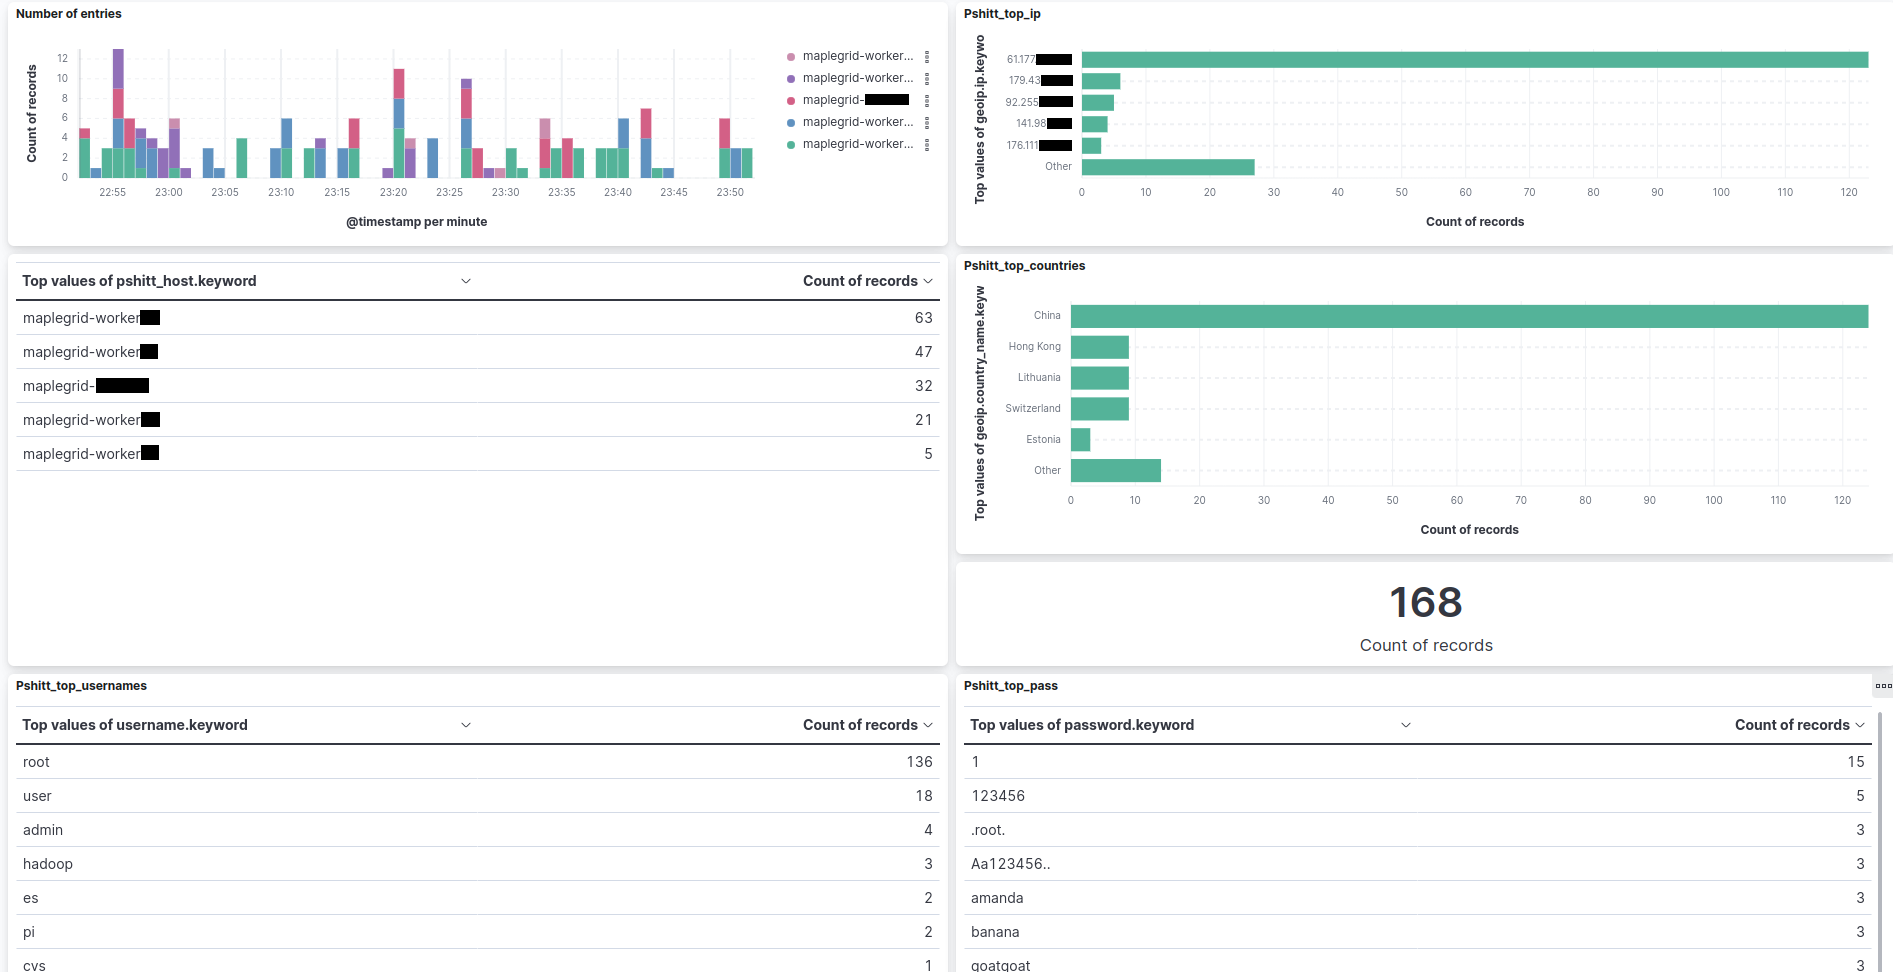 This is the data from 1 hour, we can see the ingestion from different "leaves".
with the field "pshitt_host" we can understand which leaf sent the data,
actually filebeat adds some data so the same info, taken from the vm hostname of the leaf is also found in "agent.hostname" and "agent.name",
I've added it anyway because in the first tests with Logstash I hadn't the additional fields.
# "Historical data":
one of the next steps would be importing the "Historical" data:
This data comes from when I had the predecessor of maplegrid online, which collector more than 5 million unique records in the timespan of 2016-2019 (with some service disruptions in the middle),
at the time the idea was "retrieving" other people's wordlist
Obviously the relevance of the data regarding the IPs is not very much today, but might be interesting to see the statistics of username and passwords, other than testing everything with much more data than now.
On this regard, this is the Logstash configuration to ingest from a local json file:
```
input {
file {
start_position => "beginning"
path => "/var/log/pshitt/data.json"
sincedb_path => "/dev/null"
codec => json
type => "json-log"
}
}
filter {
if [type] == "json-log" {
date {
match => [ "timestamp", "ISO8601" ]
}
}
geoip {
default_database_type => "City"
source => "src_ip"
tag_on_failure => ["geoip-city-failed"]
}
geoip {
default_database_type => "ASN"
source => "src_ip"
tag_on_failure => ["geoip-asn-failed"]
}
mutate {
add_field => { "pshitt_host" => "YOUR_ORIGINAL_HOST" }
}
}
output {
elasticsearch {
hosts => "http://localhost:9200"
index => "YOUR_ANOTHER_INDEX"
}
}
```
and you can execute logstash with a single config file like this:
```bash
/usr/share/logstash/bin/logstash -f /etc/logstash/conf.d/YOUR_CONFIGFILE.conf
```
## TODO:
- [ ] kibana/logstash: fix geo-data
- [ ] elasticsearch: understand clustering/data redundancy
- [ ] elasticsearch: understand indexes
- [ ] enable passwords on Elasticsearch and Kibana
- [ ] import "historical" data
- [ ] add the ssh version in pshitt:
- pshitt hardcodes "OpenSSH_6.6.1p1 Debian-5" as the ssh version, it should be changed to the real one of the vm (or randomly picked from a list) to avoid the fact that it's an honeypot
- to retrieve the local ssh version: ssh -V 2>&1 >/dev/null | cut -f1 -d','
- [ ] add the public ip of the leaf to the data
- this way we can apply geo-ip also to the dest_ip and try to plot that
## Notes:
- the "trunk" vm (ELK stack):
- OS: Debian 10
- CPU: 4 core
- RAM: 6gb
- Disk: 40gb
- 2 "leaves":
- OS: Debian 9
- CPU: 1 core
- RAM: 0.5gb
- Disk: 10gb
- 2 "leaves":
- OS: Debian 10
- CPU: 1 core
- RAM: 0.5gb
- Disk: 10gb
## links:
[0]: https://medium.com/devops-dudes/how-to-deploy-elasticsearch-5b1105e3063a
[1]: https://www.elastic.co/guide/en/elasticsearch/reference/current/deb.html
[2]: https://web.leandrojmp.com/posts/en/2020/10/logstash-geoip
This is the data from 1 hour, we can see the ingestion from different "leaves".
with the field "pshitt_host" we can understand which leaf sent the data,
actually filebeat adds some data so the same info, taken from the vm hostname of the leaf is also found in "agent.hostname" and "agent.name",
I've added it anyway because in the first tests with Logstash I hadn't the additional fields.
# "Historical data":
one of the next steps would be importing the "Historical" data:
This data comes from when I had the predecessor of maplegrid online, which collector more than 5 million unique records in the timespan of 2016-2019 (with some service disruptions in the middle),
at the time the idea was "retrieving" other people's wordlist
Obviously the relevance of the data regarding the IPs is not very much today, but might be interesting to see the statistics of username and passwords, other than testing everything with much more data than now.
On this regard, this is the Logstash configuration to ingest from a local json file:
```
input {
file {
start_position => "beginning"
path => "/var/log/pshitt/data.json"
sincedb_path => "/dev/null"
codec => json
type => "json-log"
}
}
filter {
if [type] == "json-log" {
date {
match => [ "timestamp", "ISO8601" ]
}
}
geoip {
default_database_type => "City"
source => "src_ip"
tag_on_failure => ["geoip-city-failed"]
}
geoip {
default_database_type => "ASN"
source => "src_ip"
tag_on_failure => ["geoip-asn-failed"]
}
mutate {
add_field => { "pshitt_host" => "YOUR_ORIGINAL_HOST" }
}
}
output {
elasticsearch {
hosts => "http://localhost:9200"
index => "YOUR_ANOTHER_INDEX"
}
}
```
and you can execute logstash with a single config file like this:
```bash
/usr/share/logstash/bin/logstash -f /etc/logstash/conf.d/YOUR_CONFIGFILE.conf
```
## TODO:
- [ ] kibana/logstash: fix geo-data
- [ ] elasticsearch: understand clustering/data redundancy
- [ ] elasticsearch: understand indexes
- [ ] enable passwords on Elasticsearch and Kibana
- [ ] import "historical" data
- [ ] add the ssh version in pshitt:
- pshitt hardcodes "OpenSSH_6.6.1p1 Debian-5" as the ssh version, it should be changed to the real one of the vm (or randomly picked from a list) to avoid the fact that it's an honeypot
- to retrieve the local ssh version: ssh -V 2>&1 >/dev/null | cut -f1 -d','
- [ ] add the public ip of the leaf to the data
- this way we can apply geo-ip also to the dest_ip and try to plot that
## Notes:
- the "trunk" vm (ELK stack):
- OS: Debian 10
- CPU: 4 core
- RAM: 6gb
- Disk: 40gb
- 2 "leaves":
- OS: Debian 9
- CPU: 1 core
- RAM: 0.5gb
- Disk: 10gb
- 2 "leaves":
- OS: Debian 10
- CPU: 1 core
- RAM: 0.5gb
- Disk: 10gb
## links:
[0]: https://medium.com/devops-dudes/how-to-deploy-elasticsearch-5b1105e3063a
[1]: https://www.elastic.co/guide/en/elasticsearch/reference/current/deb.html
[2]: https://web.leandrojmp.com/posts/en/2020/10/logstash-geoip